

Better Questions Start With a Clearer View
Generally, carrier-reported performance can look strong on paper without explaining what’s driving it. To understand what’s really happening, you need to see which services are driving the result, why shipments are arriving late, or whether the same issues keep happening.
Those missing details matter. An overall performance result can hide recurring problems within a specific service or zone, while differences in carrier methodologies can make reported numbers difficult to compare with the delivery experience your customers actually receive.
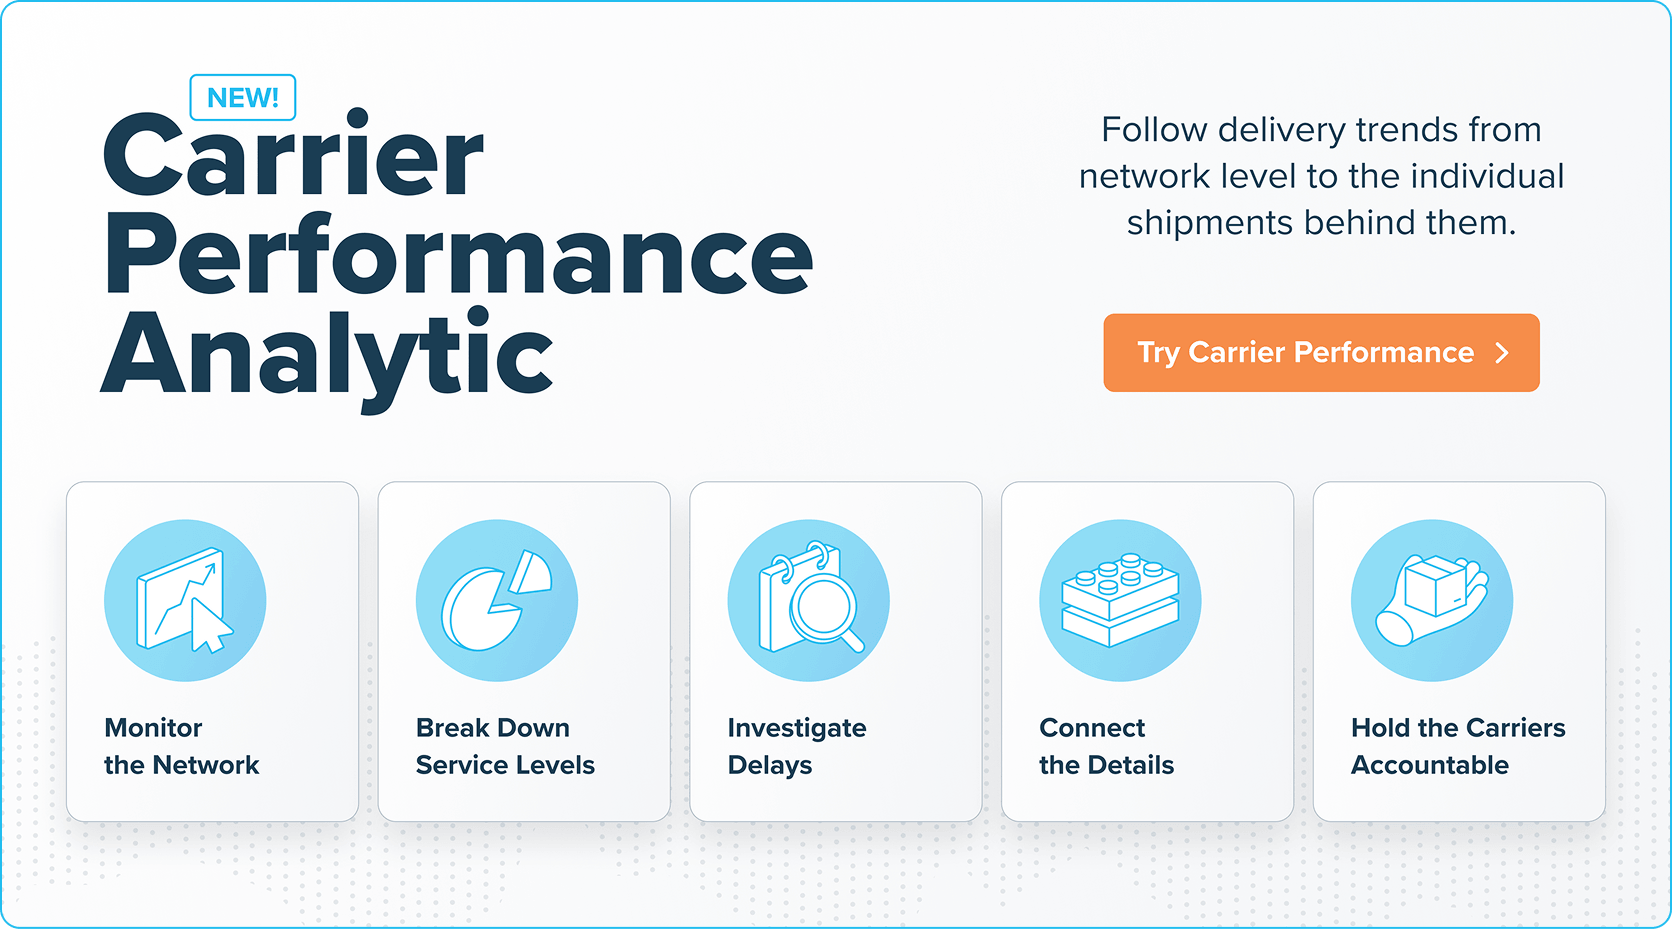
The new Carrier Performance Analytic in your Lojistic account makes carrier performance easier to investigate. Instead of pulling a report and analyzing it separately, you can filter, sort, and drill into the data directly in Lojistic to quickly isolate where issues are occurring and what is driving them.
 .
How To Start With Carrier Performance
Start broad, then progressively narrow the analysis to understand what is shaping them.
1. Start With the Overall View
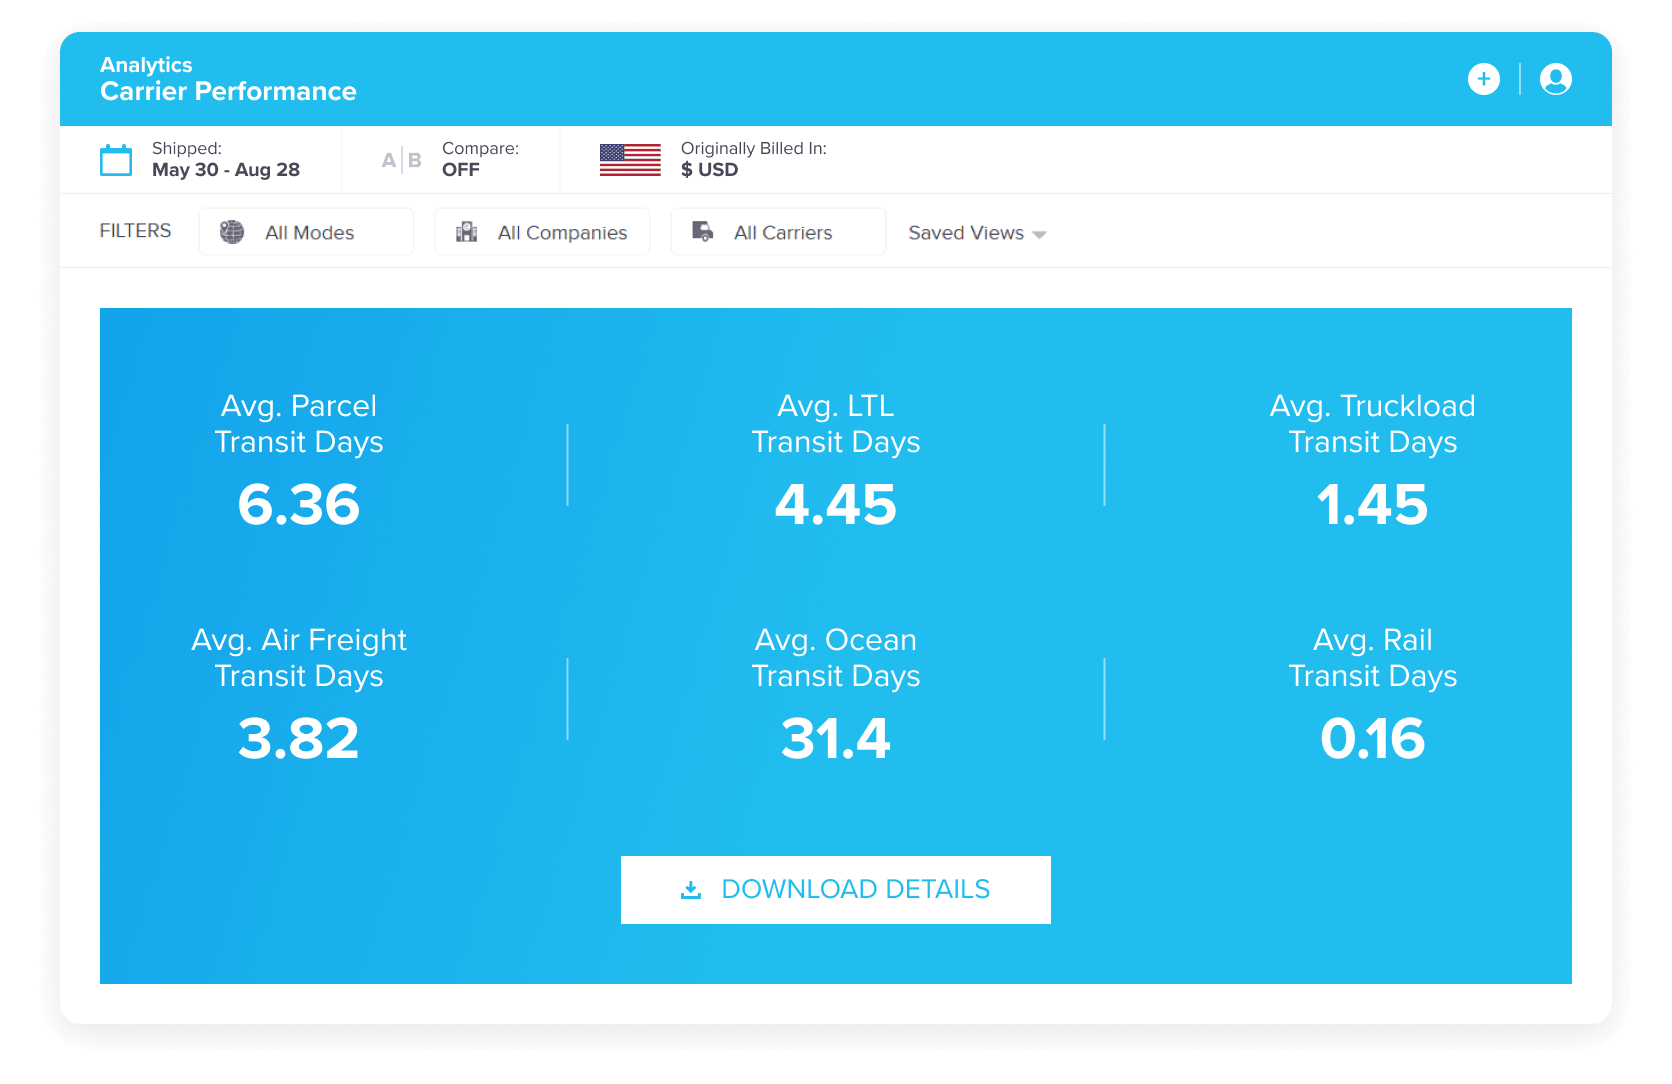
View delivery results across the shipping modes relevant to your organization, establishing the overall state of your transportation network before examining the details.
2. Drill Into Service Levels
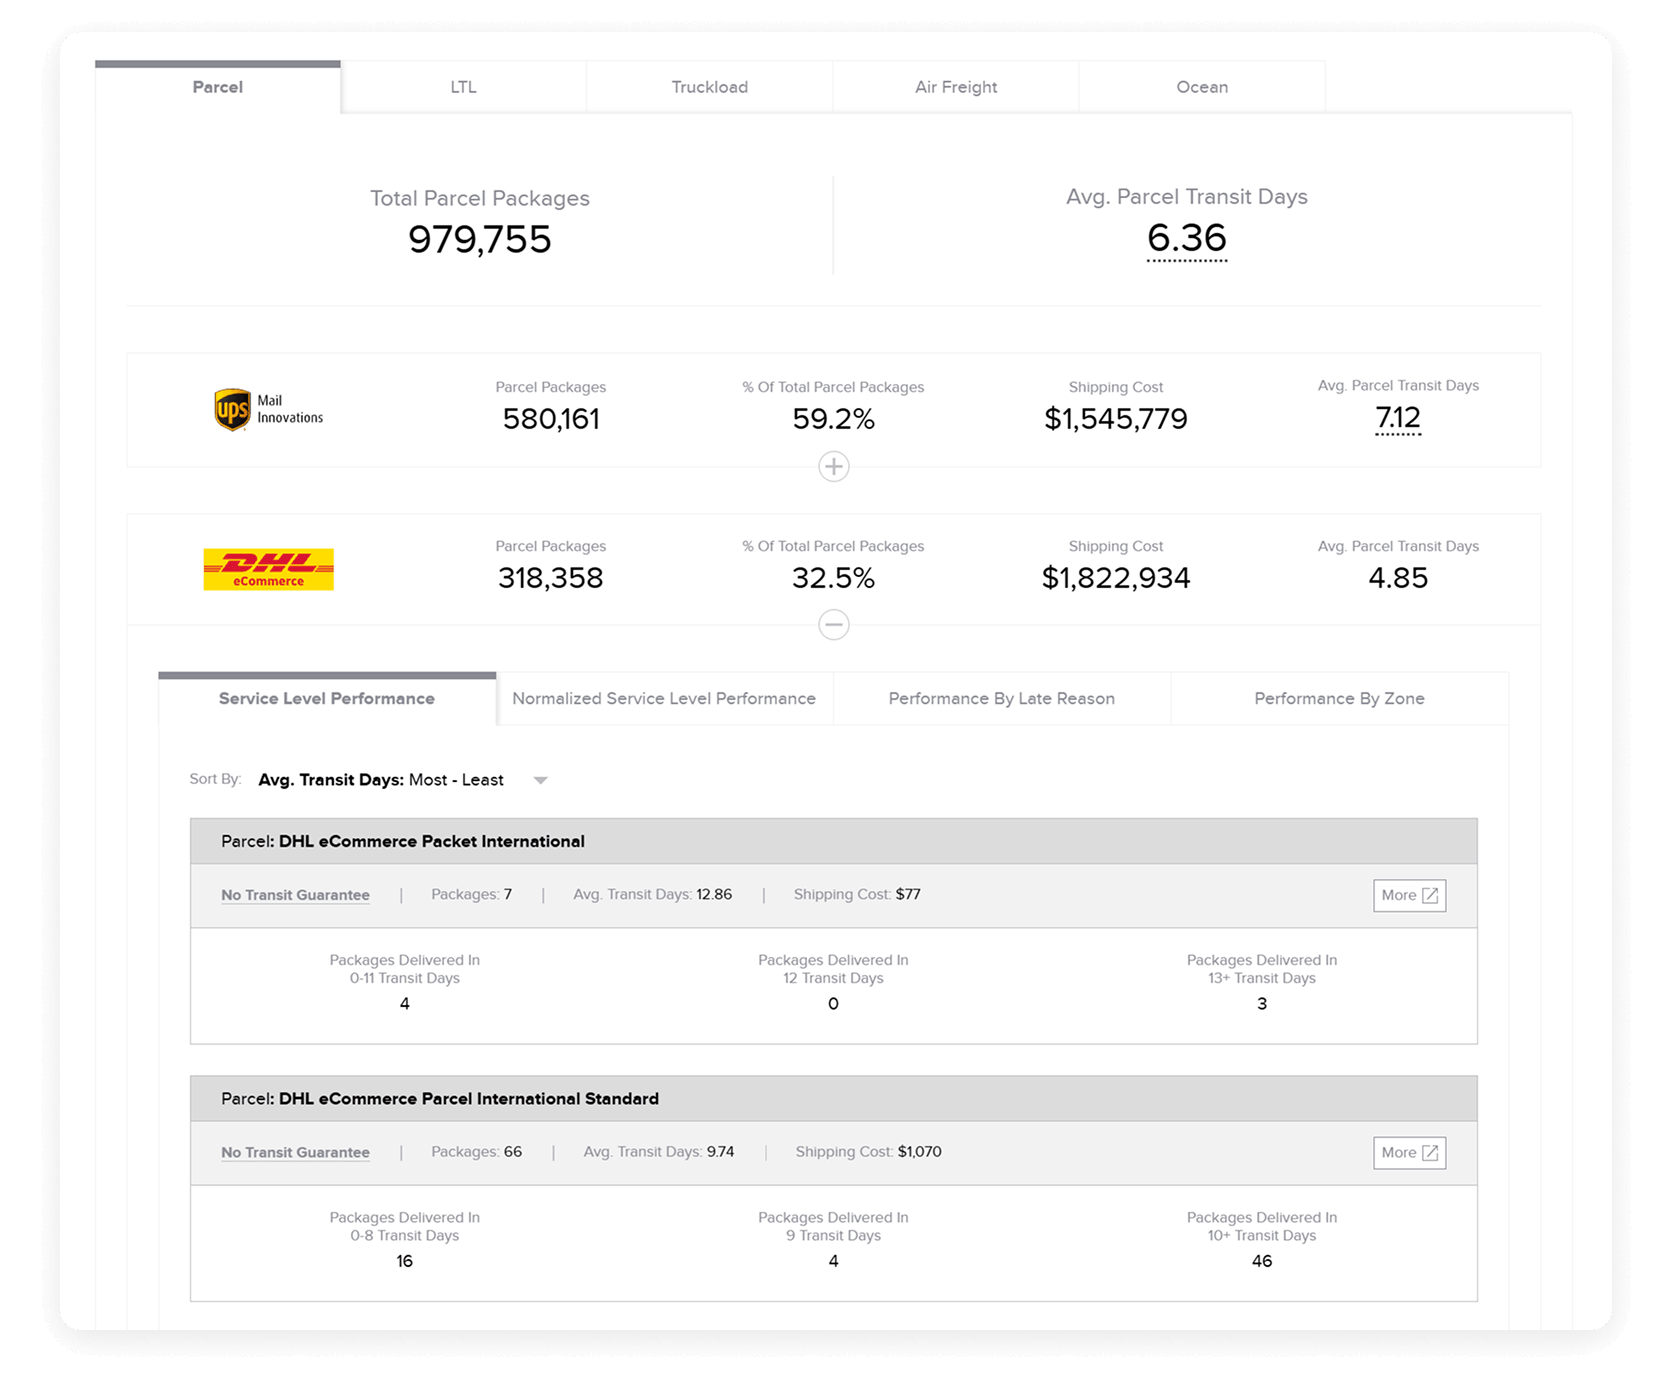
Break down the results by individual carrier service or service category to see where outcomes differ and which services may warrant a closer look.
3. Investigate the Results
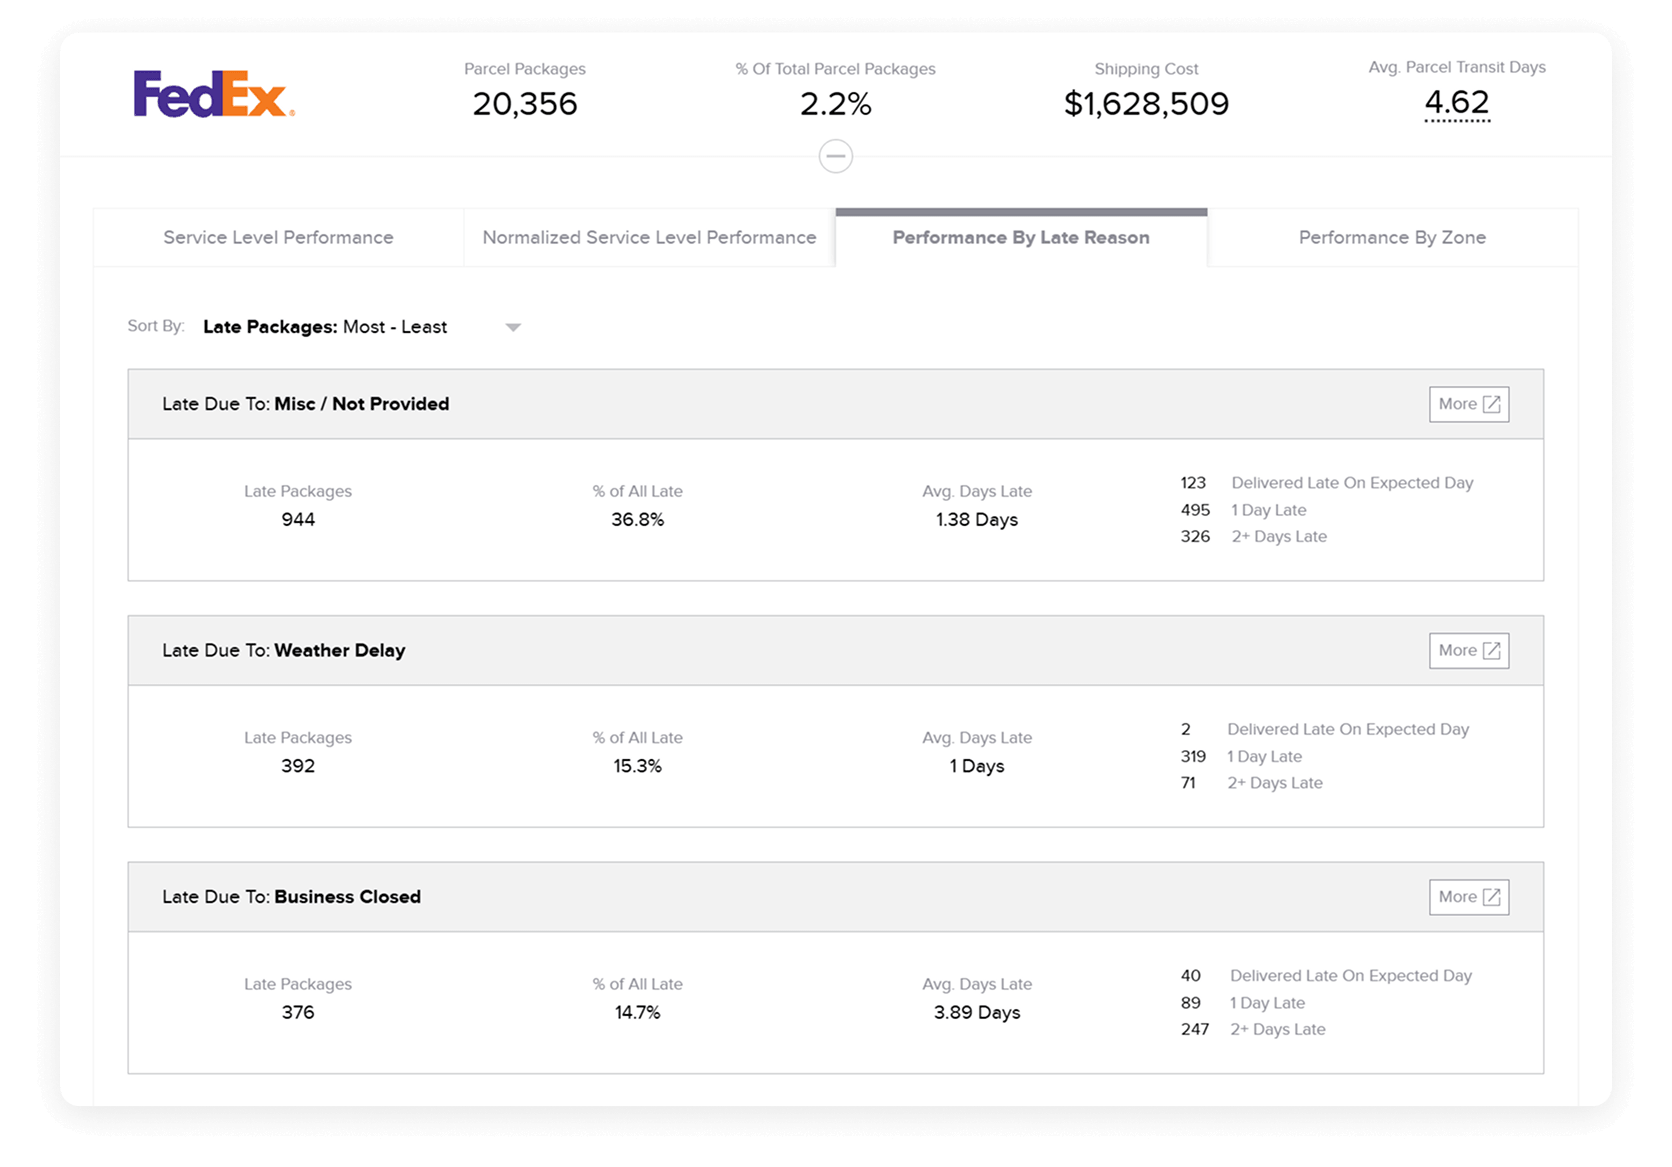
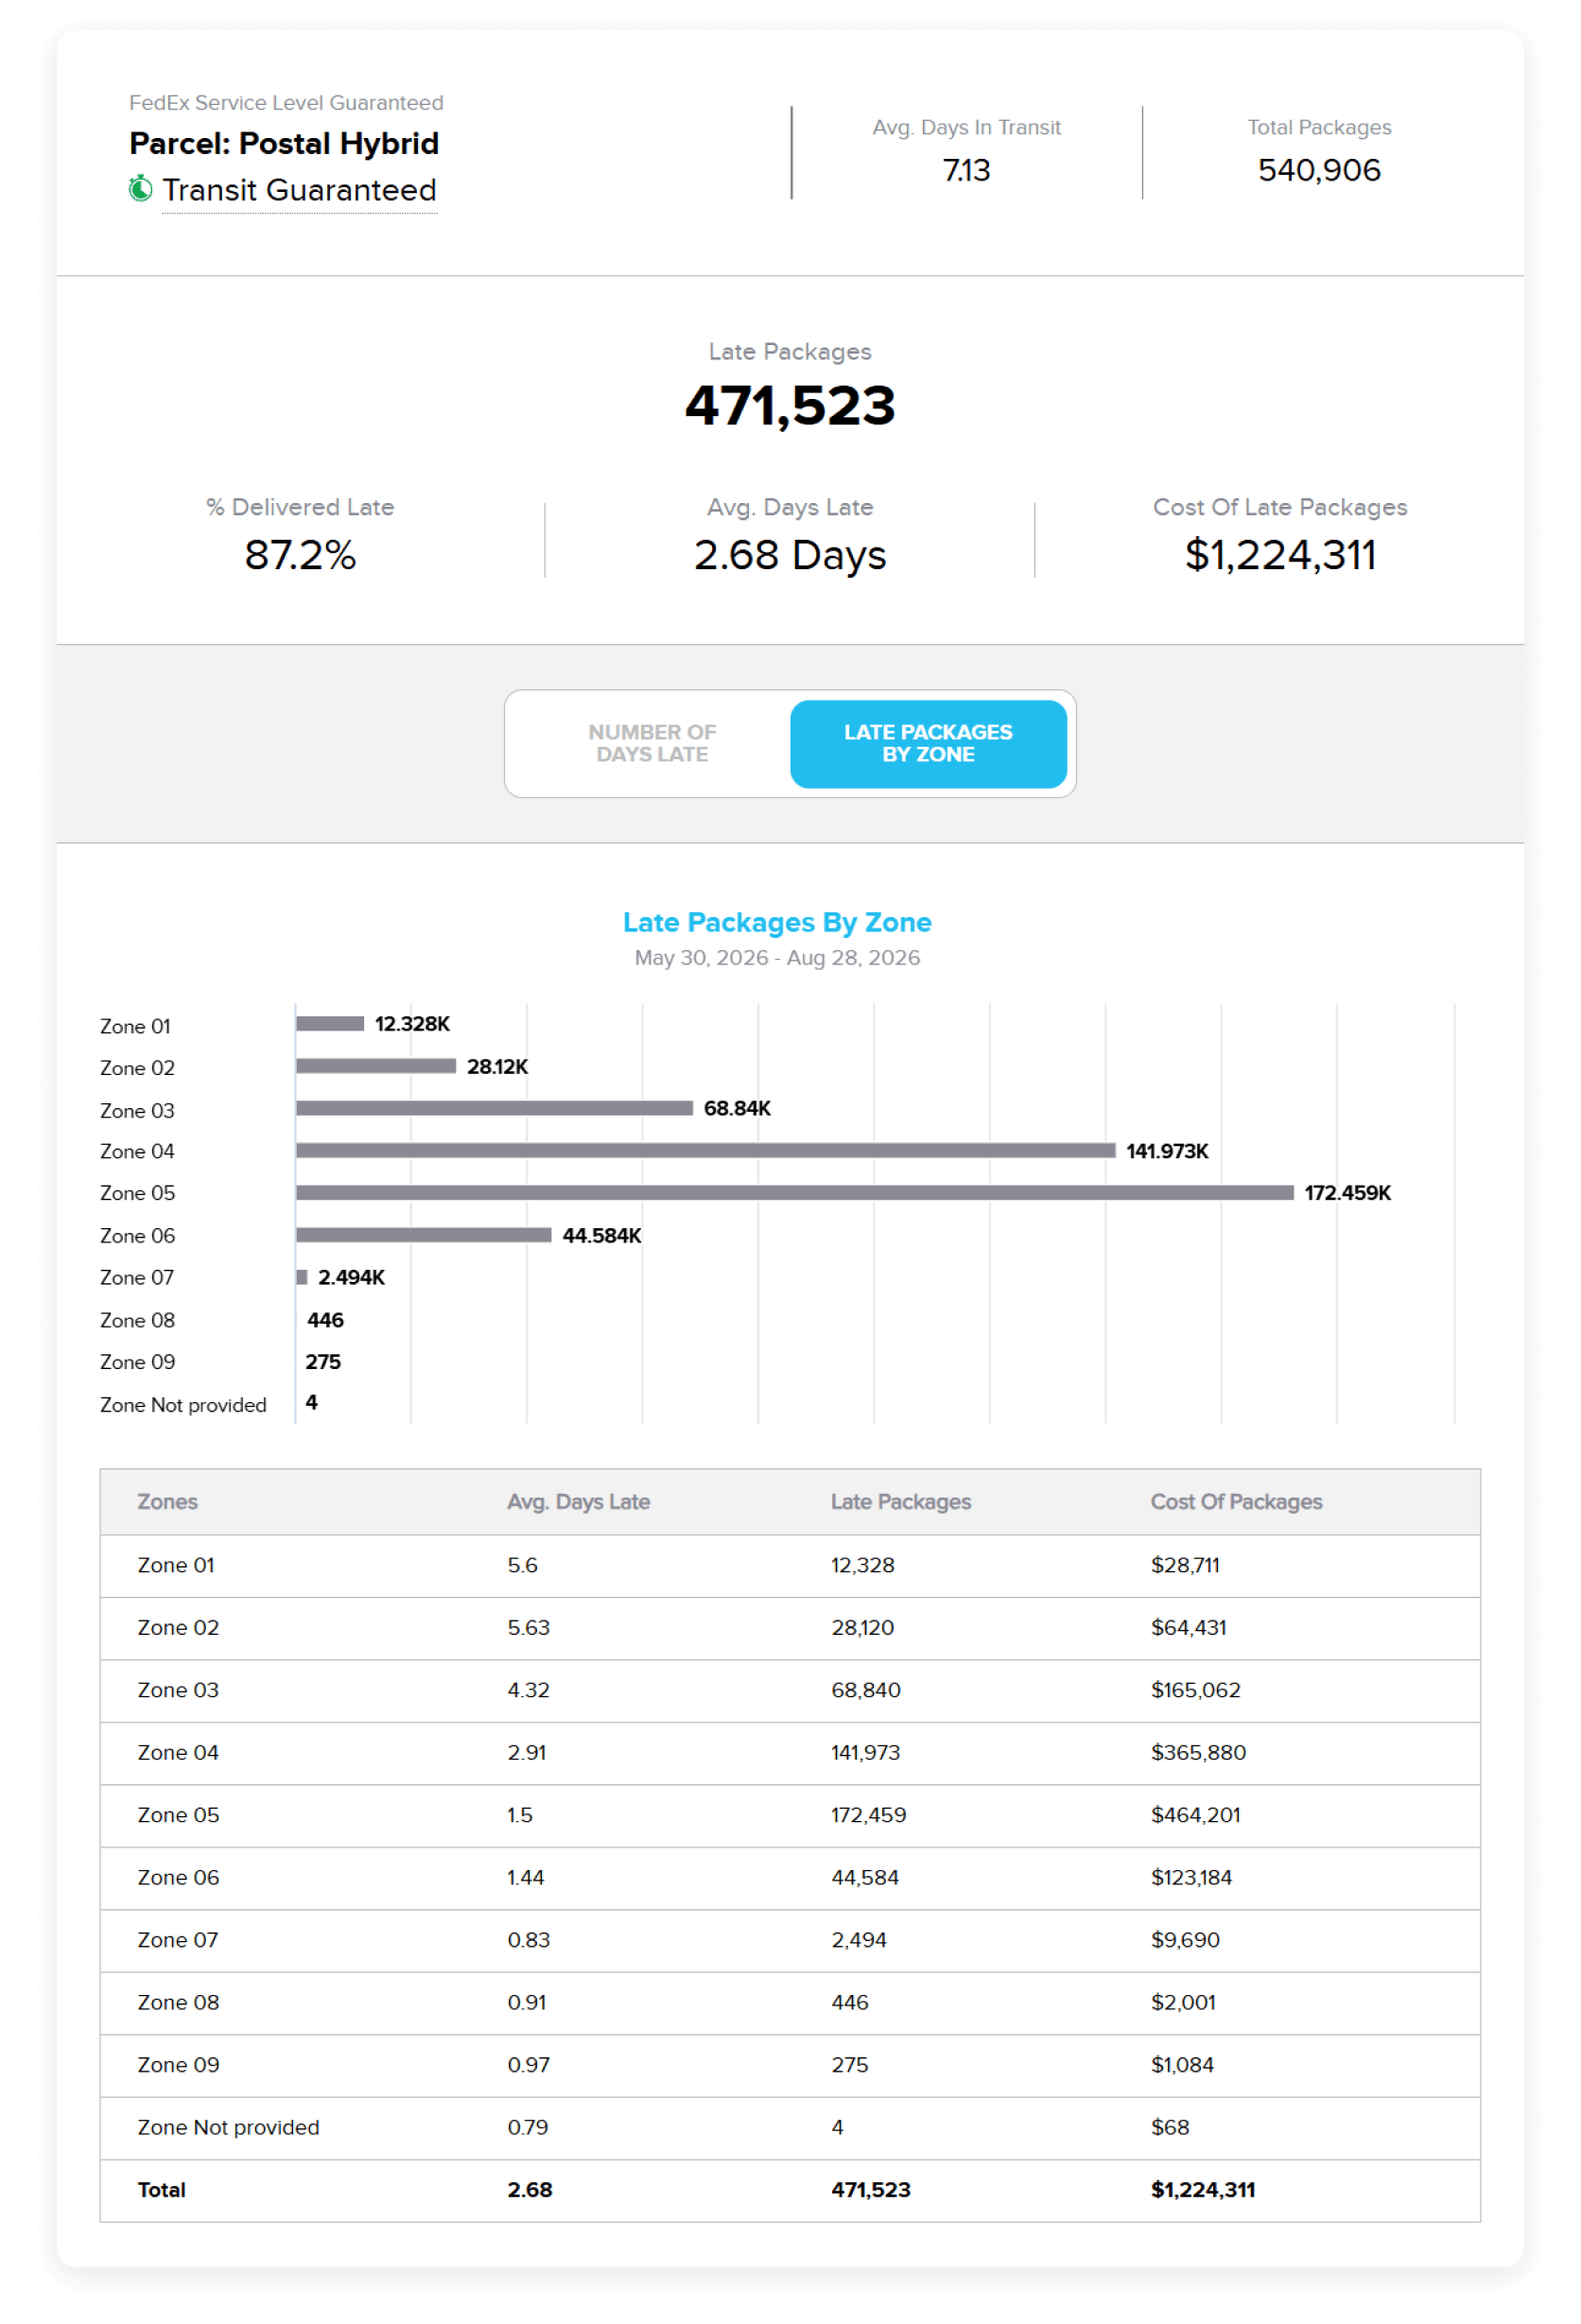
Explore carrier-provided late reasons, shipping zones, and delay severity. Rather than relying on average alone, see whether packages arrived late on the expected day, one day late, or two or more days late.
4. Connect Patterns to Shipments
When a pattern merits further review, move into the related shipment and tracking details for additional context. From there, you can determine whether an issue appears repeatedly or reflects an isolated event.
Bring More Context to Carrier Conversations
The Carrier Performance Analytic gives you a more complete view of your customer’s true experience. When results differ from carrier-reported performance because of “excusable” late reasons, those differences can point to areas that are worth a closer look.
Carrier Performance can help you explore questions such as:
Is a premium service delivering the experience you expect for the price you pay?
Are mishaps concentrated around a specific service, zone, or late reason?
Do the same delivery issues continue to appear over time?
Which insights are worth discussing during your next carrier review?
Rather than relying on anecdotes alone, you can bring broader trends and relevant shipment examples into the conversation. This creates a more informed starting point for discussing service expectations, operational considerations, and areas that may require further investigation.
Available Now in Lojistic
The Carrier Performance Analytic is available to every user on the Lojistic platform at no additional cost. Use it to establish a baseline, monitor delivery trends, investigate emerging issues, and bring greater context to your carrier conversations.
Ready to take a closer look at your carrier data? Log in to explore Carrier Performance or reach out to us.

Author
Jared Fisher
Jared Fisher
Co-Founder & Chief Revenue Officer
Jared Fisher is the Co-Founder and CRO at Lojistic. Since founding the company in 2005, Jared has helped build Lojistic into a leading shipping intelligence and spend management platform serving thousands of businesses globally across all industries.
Prior to Lojistic, Jared worked at Airborne Express (later DHL), where he saw firsthand how carrier pricing structures often obscure true costs and lead to overspending for shippers. That experience shaped his mission to bring greater transparency, control, and efficiency to business shippers.
With over two decades at the helm of Lojistic, Jared continues to lead the go-to-market strategy and client success, helping organizations leverage technology and data to reduce shipping costs and improve operational performance.