Cost Reduction Opportunities Analytic
Cut unnecessary costs. Increase profits.
Create your Lojistic account today.
Discover Where You Can Reduce Shipping Costs
The Cost Reduction Opportunities analytic identifies the areas where your shipping strategy may be leaving money on the table
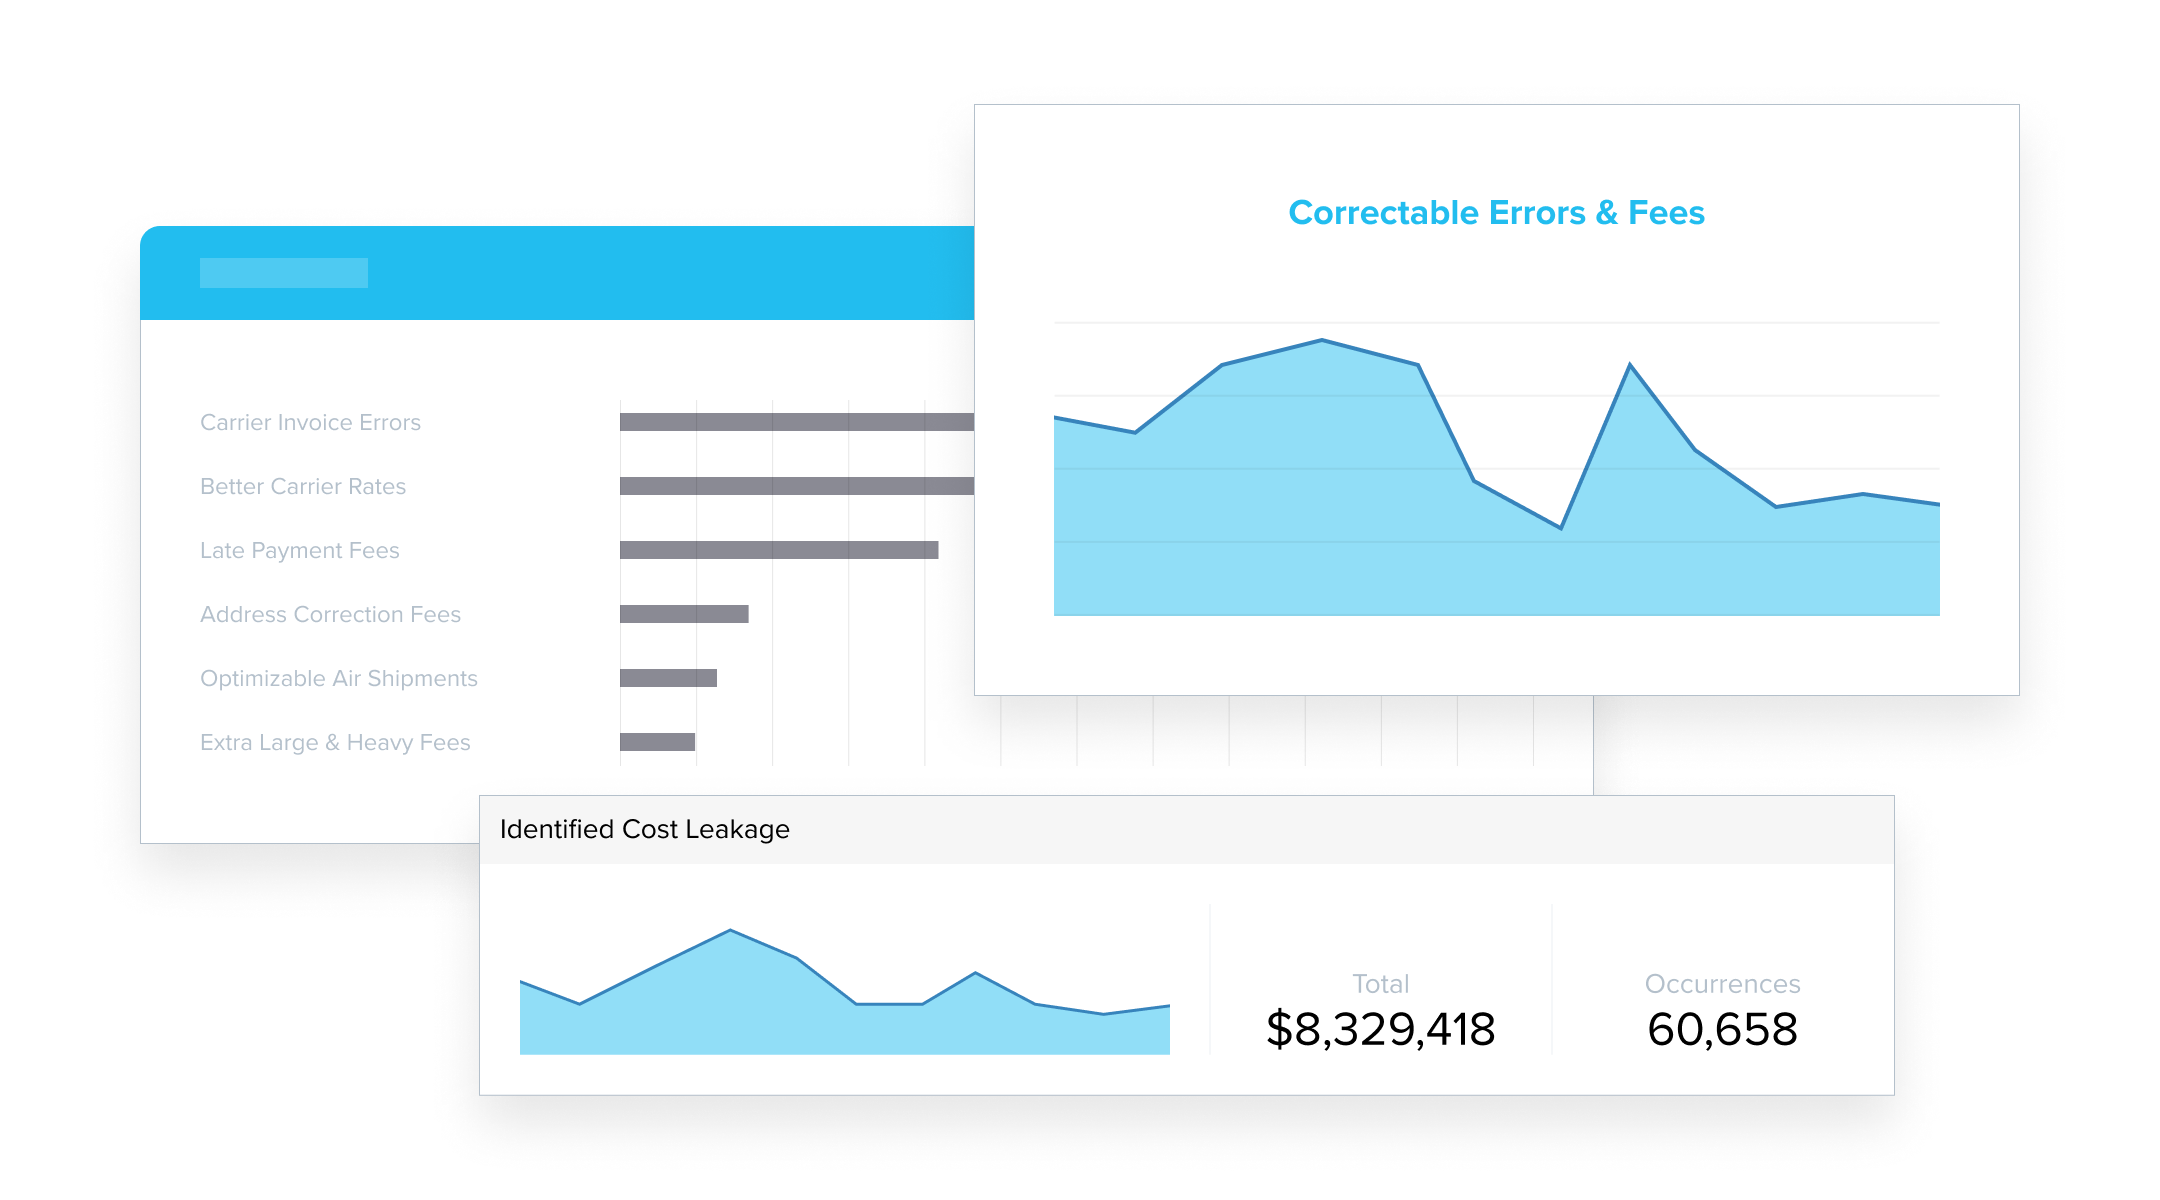
These aren't just costs buried in bills, but those embedded in behavior, routing, service choice, carrier performance, and more.
Why Cost Reduction Opportunities Matter
Shipping spend isn't one single line item. It's a composite of rates, service selection, surcharge exposure, performance variability, and operational decisions.
Reducing spend isn't only about negotiating a lower rate, it's about understanding where small changes deliver meaningful impact.
The Cost Reduction Opportunities analytic highlights patterns where smarter decisions can lower expenses without sacrificing service levels.
What You Can See Instantly
With the Cost Reduction Opportunities analytic, you can:



Turn Insight Into Action
Target the Highest-Impact Opportunities
See where changing behavior or routing yields the biggest savings.
Shift Service Strategy Without Sacrificing Reliability
Balance cost and delivery performance with data-backed recommendations.
Reduce Premium Service Overuse
Uncover patterns where service choices are costing more than they should.
Leverage Savings in Carrier Conversations
Back contract negotiations with clear opportunity insights.
 Free Account
 No Card Required
 Send Costs Packing TM
Use Lojistic to Reduce Shipping Costs
Unlimited users. All carriers. All modes.
Create an account in minutes.